


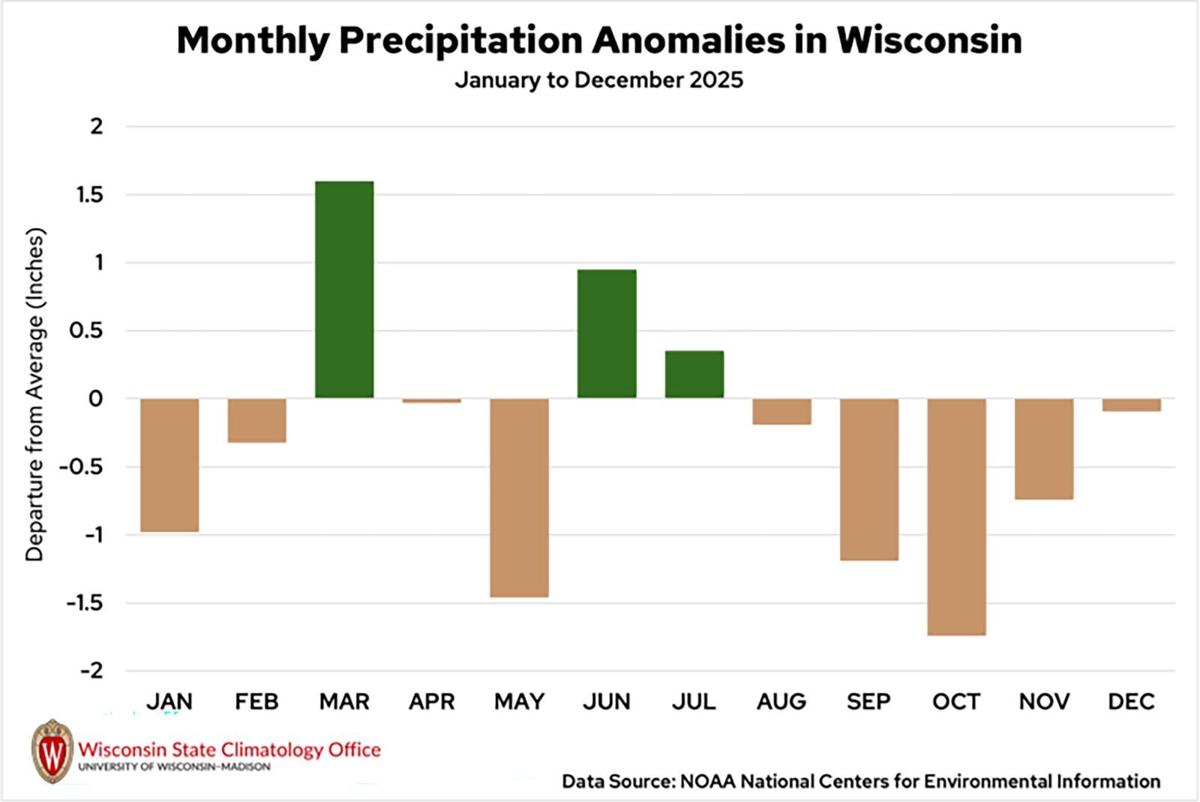
Figure 5d. Monthly statewide-average precipitation anomalies in inches are shown for Wisconsin between January and December 2025 compared to the 1991 to 2020 average. Precipitation anomalies are from NOAA’s National Centers for Environmental Information.
kAmu:8FC6 d5] |@?E9=J DE2E6H:56\2G6C286 AC64:A:E2E:@? 2?@>2=:6D :? :?496D 2C6 D9@H? 7@C (:D4@?D:? 36EH66? y2?F2CJ 2?5 s646>36C a_ad 4@>A2C65 E@ E96 `hh` E@ a_a_ 2G6C286] !C64:A:E2E:@? 2?@>2=:6D 2C6 7C@> }~pp’D }2E:@?2= r6?E6CD 7@C t?G:C@?>6?E2= x?7@C>2E:@?]k^Am
As featured on

The first month of winter began with a burst of severe cold and lingering November snow, the…
Most Popular
-
Propagating the prairie: Couple creates business out of raising native plants
-
Cattle-station cookbook helps disaster
-
Wisconsin popular destination for turkeys
-
Back to grass: Focused on conservation, Midwest farmers return cropland to prairie state
-
How Mitchell-based Trail King powers heavy haul across North America


Print Ads