


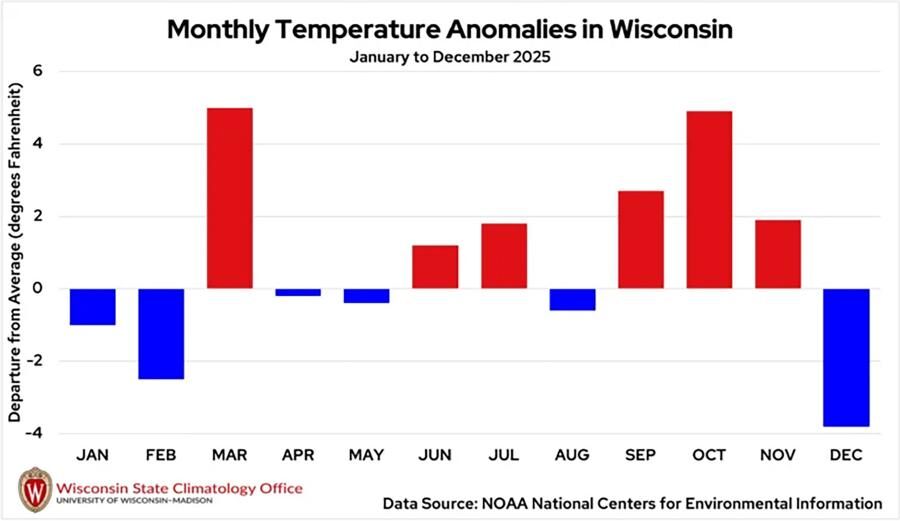
Figure 3. Shown are monthly statewide-average temperature anomalies in degrees Fahrenheit for Wisconsin between January 2025 and December 2025 compared to the 1991 to 2020 average. Temperature anomalies are from the National Oceanic and Atmospheric Administration’s National Centers for Environmental Information.
kAmu:8FC6 b] $9@H? 2C6 >@?E9=J DE2E6H:56\2G6C286 E6>A6C2EFC6 2?@>2=:6D :? 568C66D u29C6?96:E 7@C (:D4@?D:? 36EH66? y2?F2CJ a_ad 2?5 s646>36C a_ad 4@>A2C65 E@ E96 `hh` E@ a_a_ 2G6C286] %6>A6C2EFC6 2?@>2=:6D 2C6 7C@> E96 }2E:@?2= ~462?:4 2?5 pE>@DA96C:4 p5>:?:DEC2E:@?’D }2E:@?2= r6?E6CD 7@C t?G:C@?>6?E2= x?7@C>2E:@?]k^Am
As featured on

The first month of winter began with a burst of severe cold and lingering November snow, the…


Print Ads


